Clapham Footfall Data
Below are two downloadable footfall reports for June and July 2020. The area covered is the roughly the same as the Clapham BID area and includes Clapham High Street between Clapham North and Clapham Common, Clapham Old Town and North Street.
The data is provided by Placedashboard and uses GPS data linked to mobile devices. More information about the data is available here – https://placedashboard.com/about/.
Footfall Reports
Comparison to other areas
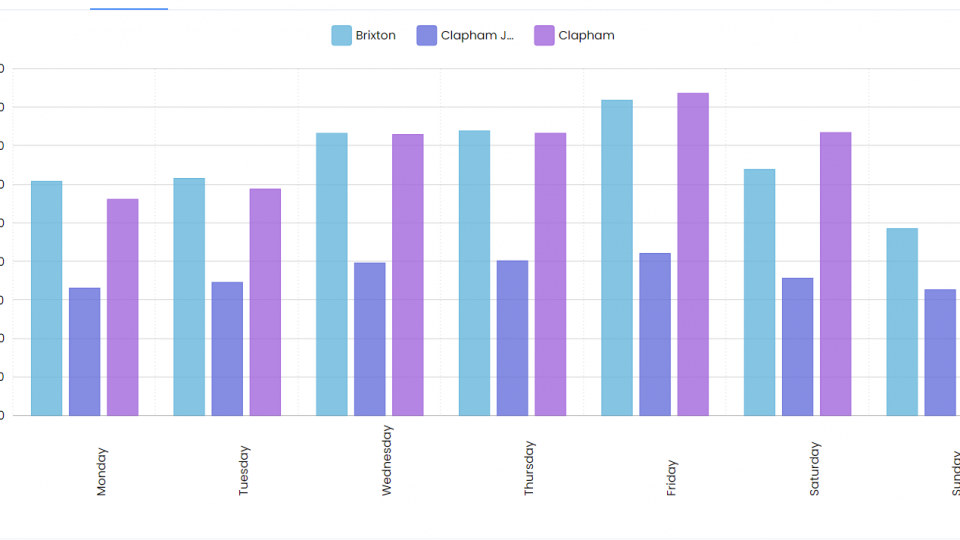
Graph above compares leisure visits of 60 -90 minutes in Brixton, Clapham Junction and Clapham (purple) in July 2020.
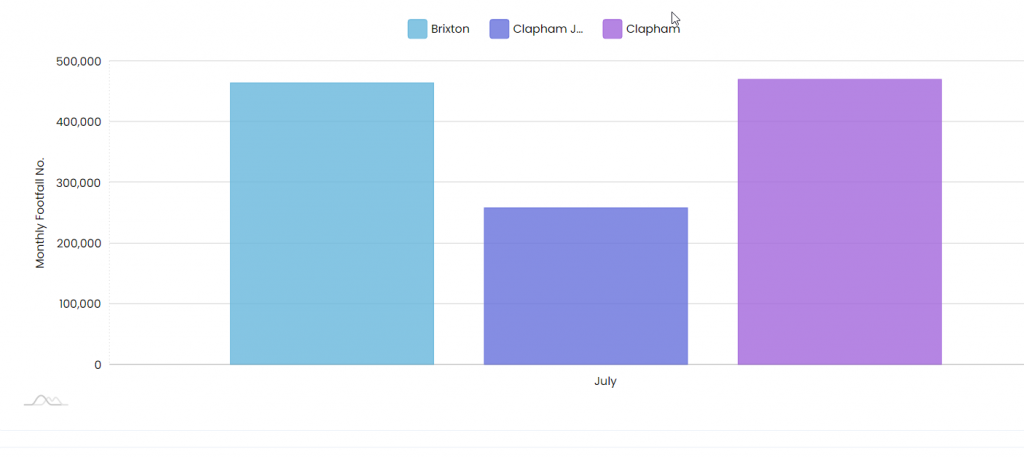
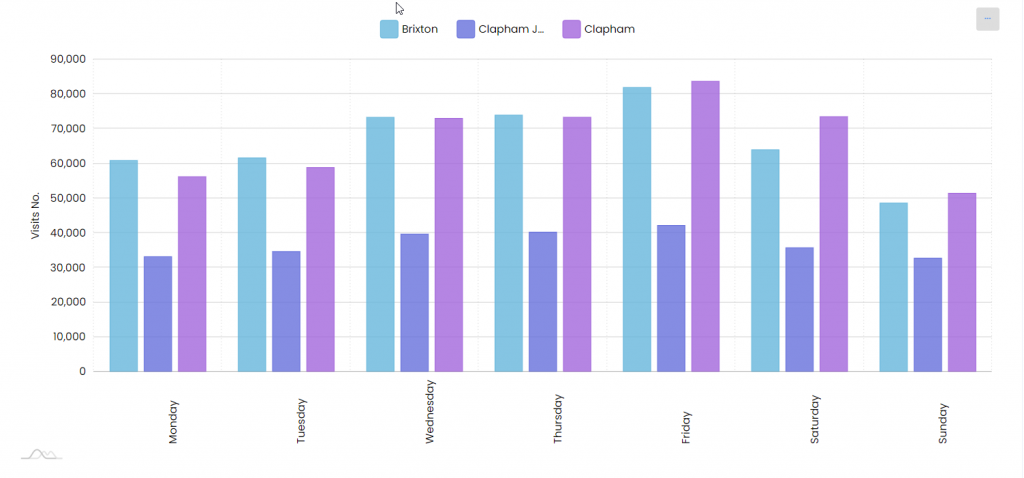
Graph above shows total footfall in Brixton, Clapham Junction and Clapham (purple) in July 2020.
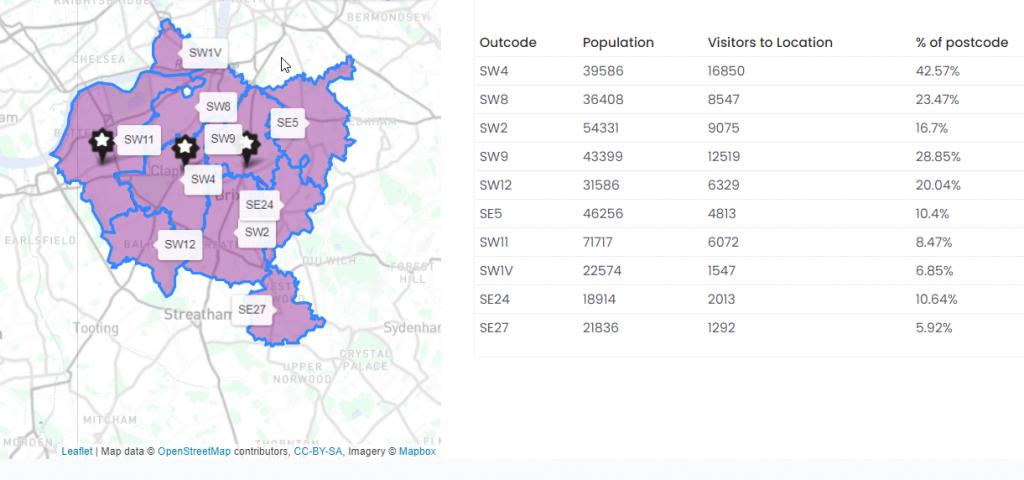
Graph above shows where the most regular visitors Clapham High Street originate from.